Lessons from the Recession (2007-2009): What story is the data telling me?
You probably have experienced that sometimes certain decisions (personal or business) are based on yours or someone’s subjective opinion rather than factual empirical evidence. When you decide to work off an opinion you are technically taking a chance. The probability of success in this case is 50%. A way to increase this probability is by means of “an educated guess”.
If you have done your due diligence and are confident about your underlying data/information, your educated guess in most cases will have a probability of success higher than 50%.
Part A: Free Data on the World Wide Web
There is a plethora of information available free of charge for the avid researcher/reader if you know what you are looking for. For example, if you ever wanted to know: “In the state of California how many male white collar group workers are employed in Cabinet Level Agencies in a technical field in the age group of 25-29 years with less than 1 year of experience”, you can get to this answer within minutes! Thanks to www.data.gov. In fact as of March 2009 the data looks like:

I am not sure if the above data is useful for you or not. The point I am trying to make is that before you pick up the phone and pay someone for information which you know should be public, do a little research yourself. You will be pleasantly surprised by what you find.
Part B: The economy and the consumer
You are constantly deluged with conflicting information from different sources that the economy is either doing better or is doing worse than expected. I can understand why there can be multiple interpretations from the same data. It is at some level dependent upon your point of reference.
Since our economy is primarily driven by consumer spending (almost 70% of it), it is important to understand how the consumer is feeling. According to the latest (November 2009) press release of the Michigan Consumer Sentiment – “Consumers’ assessments of their finances have been the grimmest since 1946, and have remained at those record low levels for most of the past two years.” The press release further points out that the consumer “When asked to explain in their own words how their finances had changed, the smallest proportion in the sixty-year history of the survey reported income gains—just 9%—and the largest proportion voluntarily cited income declines—38%.”
Before you disregard the above study as being “just another survey”, I have some data (available online free of charge) to show you.

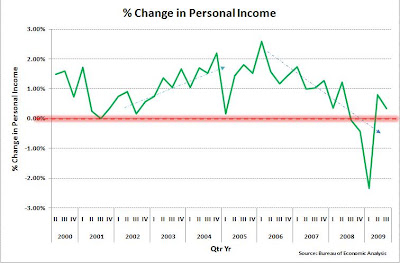
The above 2 graphs tell a compelling story about the consumer – one which is in line with the Consumer Sentiment survey. The consumer is facing declining incomes and a reduction in available credit (either because of the impact of the credit crisis OR in general is borrowing less).
So if the consumer is using less credit and not actively spending, where is the money going? This is where the next graph is an eye-opener and a cause of worry for some economists.
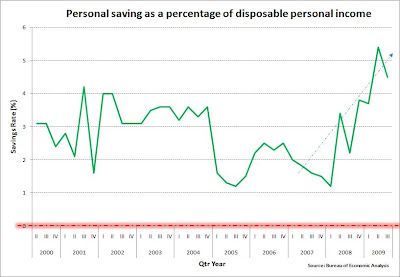
The consumer is saving more!
Part C: Convincing the “new” consumer to buy your product
As a retailer/manufacturer how would you approach this changing paradigm in the consumer’s mindset? Various corporations are doing different innovative things to drive the consumer to their business. Prominent retailers are changing their taglines to include “saving” as a part of their shopping experience.
Once again, there is data available free of charge which may come in handy! Look at the graph below.
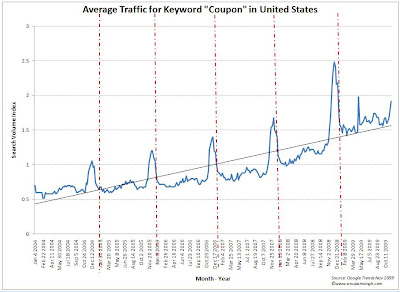
Look at the increase in traffic for the keyword “coupon”. I think a significant number of people (myself included) are going online and actively looking for coupons prior to making that trip to their local retailer or even shopping online.
Do not try to fight this trend. Embrace it and use it to make informed marketing decisions.
Feel free to post comments below. I look forward to hearing from you.
Until my next post!
Best regards,
-AS
Anupam,
ReplyDeleteWith the plethora of data available, do these get incorporated into forecasting tools (ie. Manugistics, SAS, Cloud9, etc.)? Clouding these into the systems would provide a better understanding when analyzing possible que times or help diminish any excess purchasing.
Fi